F&I Tools
  • F&I Tools
  • Loan Calculator
  • Car Tax by State
  • DMV Fees
  • Manufacturer Warranties
  • Bank Payoffs
  • ELT Codes
  • Forms
  • Underwriting
  • Sales Report
  • F&I Menu
  • My Vehicle Title
  • Get My Lost Title
  • Bill of Sale
  • Insurance Companies
  • Roadside Assistance
  • Alpha Bravo
  • Credit Union Rates
  • VW Warranty
  • Chevy Warranty
  • Jeep Warranty
  • Ford Warranty
  • Toyota Warranty
  • Hyundai Warranty
  • About
Search
  F&I Tools Trademark®
  • Automaker Revenue
  • Ford

Ford Worldwide Sales by Year - Total Vehicles and Revenue
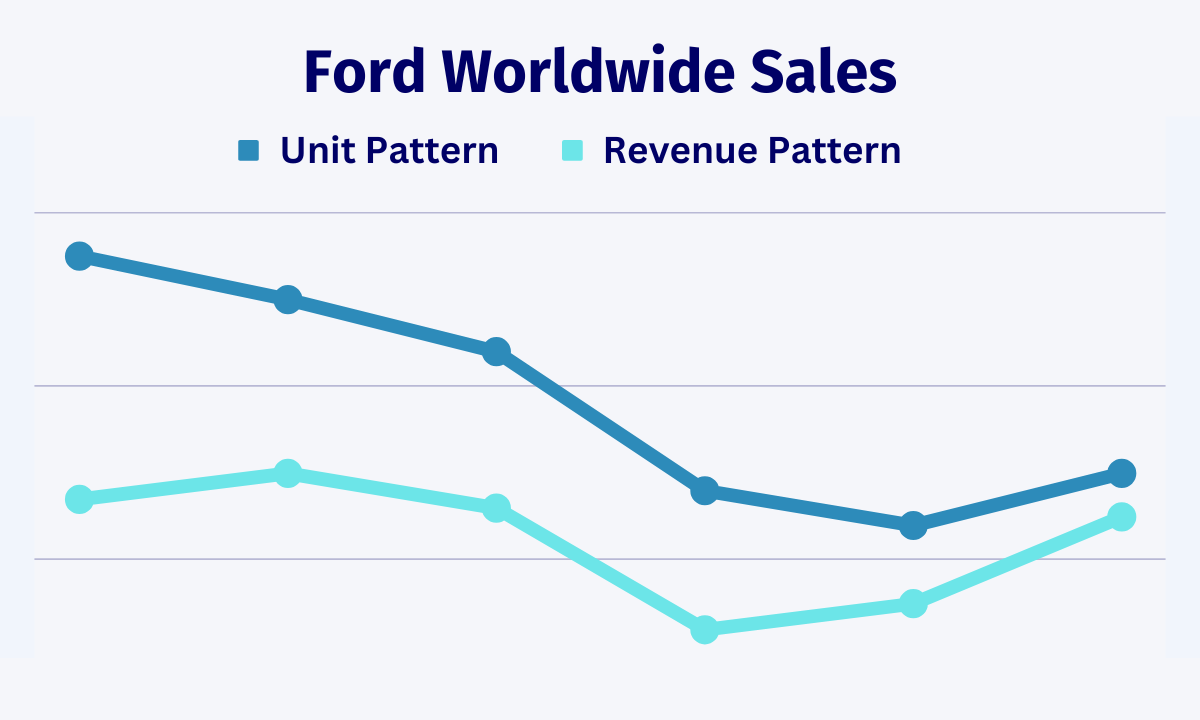

Ford worldwide sales reached 4.47 million vehicles for $173 billion in revenue in 2024. Unit volume was up 1% year over year with global revenue up 4% and profit down 7%. 

Ford employs over 183,000 people worldwide and sells vehicles at nearly 10,000 retail dealerships sourced by 48 manufacturing and assembly plants.

The profit displayed is gross profit after the cost of materials is subtracted, but before administrative fees.
Red Cars Over Globe
Ford Worldwide Sales Report
Year Category Results Status
2024

Ford Sales 4,470,165 ↑ 1%
Revenue 172.7 Billion ↑ 4%
Cost 158.4 Billion ↑ 5%
Profit 14.3 Billion ↓ 7%
Per Vehicle $3,199 ↓ 8%
2023

Ford Sales 4,413,545 ↑ 4%
Revenue 165.9 Billion ↑ 11%
Cost 150.6 Billion ↑ 12%
Profit 15.3 Billion ↑ 5%
Per Vehicle $3,467 ↑ 1%
2022

Ford Sales 4,235,737 ↑ 7%
Revenue 149 Billion ↑ 18%
Cost 134.4 Billion ↑ 17%
Profit 14.6 Billion ↑ 27%
Per Vehicle $3,447 ↑ 18%
2021

Ford Sales 3,942,755 ↓ 7%
Revenue 126.2 Billion ↑ 9%
Cost 114.7 Billion ↑ 2%
Profit 11.5 Billion ↑ 371%
Per Vehicle $2,917 ↑ 392%
2020

Ford Sales 4,231,549 ↓ 21%
Revenue 115.9 Billion ↓ 19%
Cost 112.8 Billion ↓ 16%
Profit 3.1 Billion ↓ 65%
Per Vehicle $733 ↓ 55%
2019

Ford Sales 5,386,239 ↓ 10%
Revenue 143.6 Billion ↓ 3%
Cost 134.7 Billion ↓ 1%
Profit 8.9 Billion ↓ 26%
Per Vehicle $1,652 ↓ 18%
2018

Ford Sales 5,982,478 ↓ 9%
Revenue 148.3 Billion ↑ 2%
Cost 136.3 Billion ↑ 4%
Profit 12 Billion ↓ 17%
Per Vehicle $2,006 ↓ 8%
2017

Ford Sales 6,607,176 ↓ 1%
Revenue 145.7 Billion ↑ 3%
Cost 131.3 Billion ↑ 4%
Profit 14.4 Billion ↓ 4%
Per Vehicle $2,179 ↓ 3%
2016

Ford Sales 6,651,832 ↑ 1%
Revenue 141.6 Billion ↑ 1%
Cost 126.6 Billion ↑ 2%
Profit 15 Billion ↓ 7%
Per Vehicle $2,255 ↓ 7%
2015

Ford Sales 6,635,541 ↑ 5%
Revenue 140.6 Billion ↑ 4%
Cost 124.5 Billion ↓ 1%
Profit 16.1 Billion ↑ 49%
Per Vehicle $2,426 ↑ 42%
2014

Ford Sales 6,323,473 ↓ 1%
Revenue 135.8 Billion ↓ 3%
Cost 125 Billion ↑ 4%
Profit 10.8 Billion ↓ 44%
Per Vehicle $1,708 ↓ 44%
2013

Ford Sales 6,330,912 ↑ 12%
Revenue 139.4 Billion ↑ 10%
Cost 120.2 Billion ↑ 7%
Profit 19.2 Billion ↑ 37%
Per Vehicle $3,033 ↑ 23%
2012

Ford Sales 5,668,233 ↓ 1%
Revenue 126.6 Billion ↓ 1%
Cost 112.6 Billion ↓ 1%
Profit 14 Billion ↓ 5%
Per Vehicle $2,470 ↓ 5%
2011

Ford Sales 5,695,747
Revenue 128.2 Billion
Cost 113.4 Billion
Profit 14.8 Billion
Per Vehicle $2,598
Ford Worldwide Vehicle Sales Pattern

Compare Automakers by Revenue
About       Contact       Privacy       Terms
F&I Tools Logo
© 2025 F&I Tools USA 

  • F&I Tools
  • Loan Calculator
  • Car Tax by State
  • DMV Fees
  • Manufacturer Warranties
  • Bank Payoffs
  • ELT Codes
  • Forms
  • Underwriting
  • Sales Report
  • F&I Menu
  • My Vehicle Title
  • Get My Lost Title
  • Bill of Sale
  • Insurance Companies
  • Roadside Assistance
  • Alpha Bravo
  • Credit Union Rates
  • VW Warranty
  • Chevy Warranty
  • Jeep Warranty
  • Ford Warranty
  • Toyota Warranty
  • Hyundai Warranty
  • About