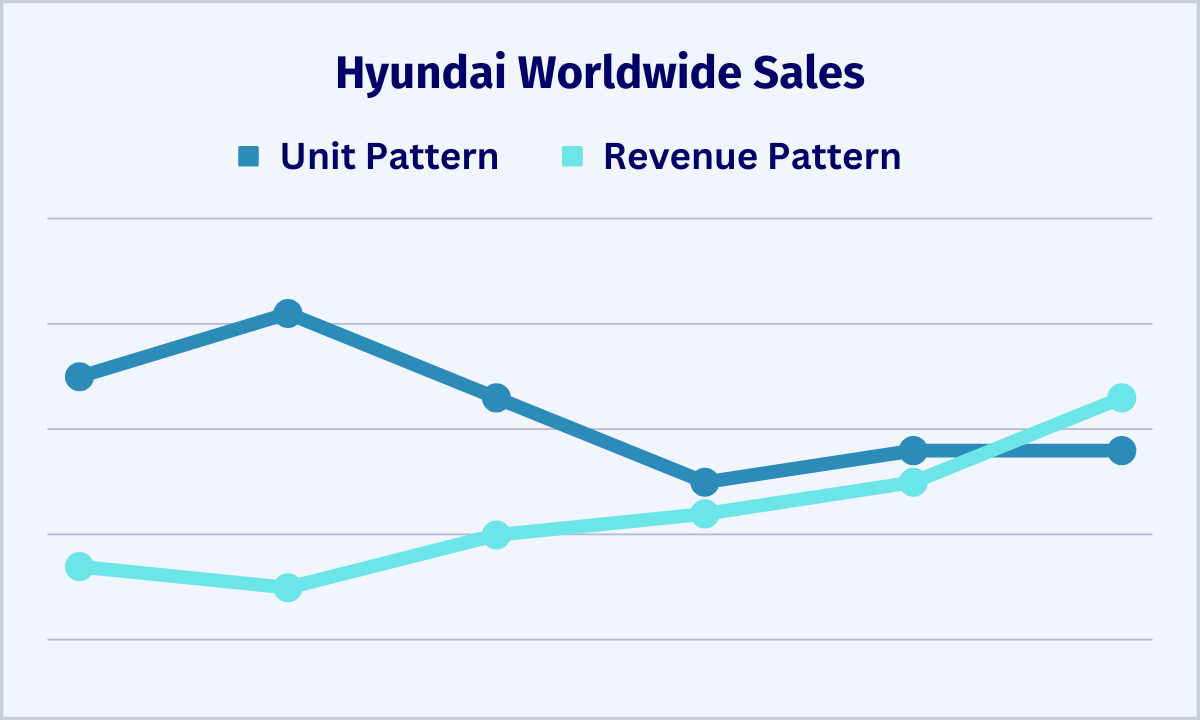
F&I Tools
  • F&I Tools
  • Loan Calculator
  • Car Tax by State
  • DMV Fees
  • Manufacturer Warranties
  • Bank Payoffs
  • ELT Codes
  • Forms
  • Underwriting
  • Sales Report
  • F&I Menu
  • My Vehicle Title
  • Get My Lost Title
  • Bill of Sale
  • Insurance Companies
  • Roadside Assistance
  • Alpha Bravo
  • Credit Union Rates
  • VW Warranty
  • Chevy Warranty
  • Jeep Warranty
  • Ford Warranty
  • Toyota Warranty
  • Hyundai Warranty
  • About
Search
  F&I Tools Trademark®
  • Automaker Revenue
  • Hyundai

Hyundai Worldwide Sales by Year - Total Vehicles and Revenue

Hyundai worldwide car sales reached 4.1 million vehicles for $119 billion USD revenue in 2024.

Unit volume was down 1% year over year, global revenue was down 5%, and profit was down 6%.

South Korean Won was converted to USD using the conversion rates from December 31st of each year listed.

​The profit displayed is gross profit after the cost of materials is subtracted, but before administrative fees.
Red Cars Over Globe
Hyundai Global Sales
Year Category Results Status
2024

Hyundai Sales 4,141,791 ↓ 1%
Revenue 118.9 Billion ↓ 5%
Cost 94.6 Billion ↓ 5%
Profit 24.3 Billion ↓ 6%
Per Vehicle $5,867 ↓ 5%
2023

Hyundai Sales 4,216,680 ↑ 7%
Revenue 125.7 Billion ↑ 11%
Cost 99.8 Billion ↑ 10%
Profit 25.9 Billion ↑ 15%
Per Vehicle $6,142 ↑ 8%
2022

Hyundai Sales 3,944,579 ↑ 1%
Revenue 113.2 Billion ↑ 15%
Cost 90.7 Billion ↑ 13%
Profit 22.5 Billion ↑ 22%
Per Vehicle $5,704 ↑ 20%
2021

Hyundai Sales 3,890,981 ↑ 4%
Revenue 98.9 Billion ↑ 3%
Cost 80.4 Billion ↑ 2%
Profit 18.5 Billion ↑ 9%
Per Vehicle $4,754 ↑ 5%
2020

Hyundai Sales 3,743,514 ↓ 15%
Revenue 95.7 Billion ↑ 5%
Cost 78.7 Billion ↑ 3%
Profit 17 Billion ↑ 11%
Per Vehicle $4,541 ↑ 31%
2019

Hyundai Sales 4,425,528 ↓ 4%
Revenue 91.5 Billion ↑ 5%
Cost 76.2 Billion ↑ 4%
Profit 15.3 Billion ↑ 13%
Per Vehicle $3,457 ↑ 17%
2018

Hyundai Sales 4,589,199 ↑ 2%
Revenue 86.9 Billion ↓ 4%
Cost 73.3 Billion ↓ 1%
Profit 13.6 Billion ↓ 18%
Per Vehicle $2,963 ↓ 19%
2017

Hyundai Sales 4,506,275 ↓ 7%
Revenue 90.3 Billion ↑ 16%
Cost 73.8 Billion ↑ 17%
Profit 16.5 Billion ↑ 12%
Per Vehicle $3,662 ↑ 21%
2016

Hyundai Sales 4,860,049 ↓ 2%
Revenue 77.6 Billion ↓ 1%
Cost 62.9 Billion ↑ ↓
Profit 14.7 Billion ↓ 5%
Per Vehicle $3,025 ↓ 3%
2015

Hyundai Sales 4,964,831 ↑ ↓
Revenue 78.3 Billion ↓ 4%
Cost 62.7 Billion ↓ 2%
Profit 15.5 Billion ↓ 11%
Per Vehicle $3,122 ↓ 11%
2014

Hyundai Sales 4,963,456 ↑ 5%
Revenue 81.6 Billion ↓ 2%
Cost 64.1 Billion ↓ 1%
Profit 17.5 Billion ↓ 5%
Per Vehicle $3,525 ↓ 9%
2013

Hyundai Sales 4,732,533 ↑ 8%
Revenue 82.9 Billion ↑ 4%
Cost 64.5 Billion ↑ 6%
Profit 18.4 Billion ↑ ↓
Per Vehicle $3,888 ↓ 6%
2012

Hyundai Sales 4,401,947 ↑ 9%
Revenue 79.4 Billion ↑ 18%
Cost 61.1 Billion ↑ 22%
Profit 18.3 Billion ↑ 8%
Per Vehicle $4,157 ↓ 1%
2011

Hyundai Sales 4,051,716
Revenue 67.1 Billion
Cost 50.1 Billion
Profit 17 Billion
Per Vehicle $4,195
Hyundai Worldwide Sales Patterns

Compare Automakers by Revenue
About       Contact       Privacy       Terms
F&I Tools Logo
© 2025 F&I Tools USA 

  • F&I Tools
  • Loan Calculator
  • Car Tax by State
  • DMV Fees
  • Manufacturer Warranties
  • Bank Payoffs
  • ELT Codes
  • Forms
  • Underwriting
  • Sales Report
  • F&I Menu
  • My Vehicle Title
  • Get My Lost Title
  • Bill of Sale
  • Insurance Companies
  • Roadside Assistance
  • Alpha Bravo
  • Credit Union Rates
  • VW Warranty
  • Chevy Warranty
  • Jeep Warranty
  • Ford Warranty
  • Toyota Warranty
  • Hyundai Warranty
  • About