F&I Tools
  • F&I Tools
  • Loan Calculator
  • Car Tax by State
  • DMV Fees
  • Manufacturer Warranties
  • Bank Payoffs
  • ELT Codes
  • Forms
  • Underwriting
  • Sales Report
  • F&I Menu
  • My Vehicle Title
  • Get My Lost Title
  • Bill of Sale
  • Insurance Companies
  • Roadside Assistance
  • Alpha Bravo
  • Credit Union Rates
  • VW Warranty
  • Chevy Warranty
  • Jeep Warranty
  • Ford Warranty
  • Toyota Warranty
  • Hyundai Warranty
  • About
Search
  F&I Tools Trademark®
  • Automaker Revenue
  • Kia

Kia Worldwide Sales by Year - Total Vehicles and Revenue

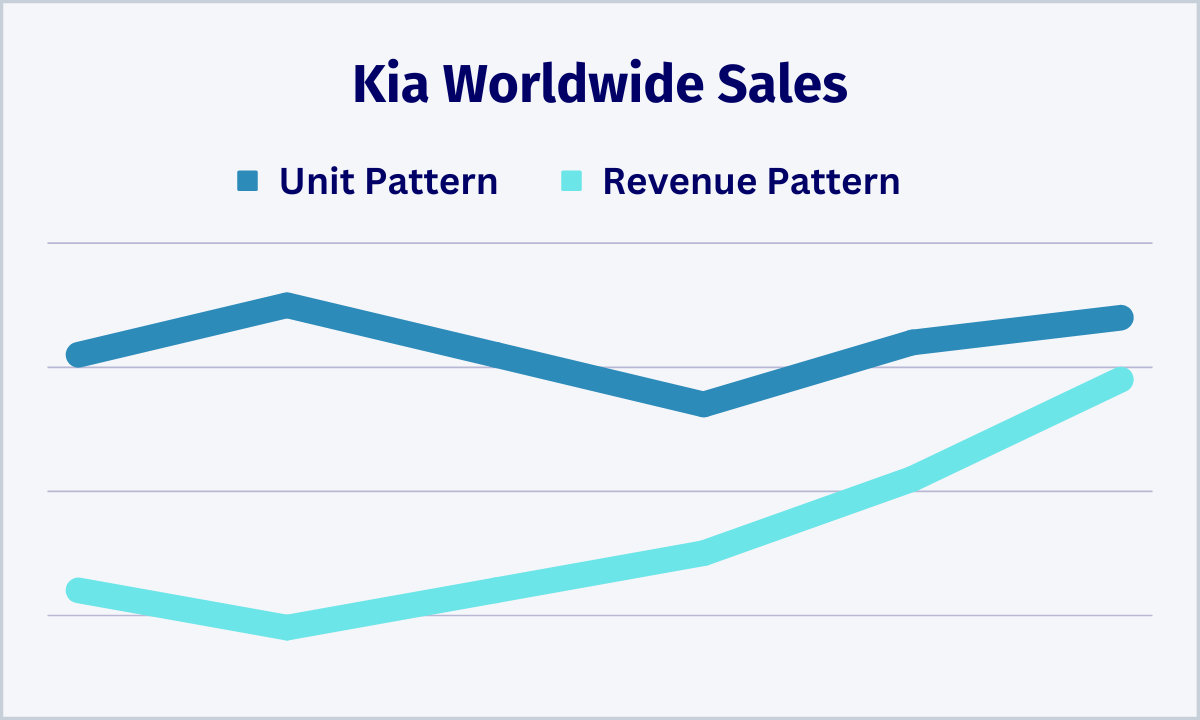
Kia worldwide sales reached 3 million vehicles for $73 billion in revenue for 2024.

Unit volume was up 1% by year with global revenue down 5% and profit down 4%.

South Korean Won was converted to US Dollars using the conversion rate from December 31st of each year listed.

​The profit displayed is gross profit after the cost of materials is subtracted, but before administrative fees.
Red Cars Over Globe
Kia Worldwide Sales
Year Category Results Status
2024

Kia Sales 3,089,457 ↑ 1%
Revenue 72.9 Billion ↓ 5%
Cost 56.1 Billion ↓ 6%
Profit 16.8 Billion ↓ 4%
Per Vehicle $5,438 ↓ 4%
2023

Kia Sales 3,087,384 ↑ 6%
Revenue 77.1 Billion ↑ 12%
Cost 59.6 Billion ↑ 10%
Profit 17.5 Billion ↑ 22%
Per Vehicle $5,668 ↑ 14%
2022

Kia Sales 2,903,619 ↑ 5%
Revenue 68.6 Billion ↑ 17%
Cost 54.3 Billion ↑ 13%
Profit 14.3 Billion ↑ 32%
Per Vehicle $4,959 ↑ 28%
2021

Kia Sales 2,777,056 ↑ 7%
Revenue 58.7 Billion ↑ 8%
Cost 47.9 Billion ↑ 6%
Profit 10.8 Billion ↑ 19%
Per Vehicle $3,889 ↑ 11%
2020

Kia Sales 2,606,832 ↓ 6%
Revenue 54.4 Billion ↑ 8%
Cost 45.3 Billion ↑ 7%
Profit 9.1 Billion ↑ 12%
Per Vehicle $3,490 ↑ 19%
2019

Kia Sales 2,772,076 ↓ 2%
Revenue 50.3 Billion ↑ 4%
Cost 42.2 Billion ↑ 2%
Profit 8.1 Billion ↑ 13%
Per Vehicle $2,922 ↑ 14%
2018

Kia Sales 2,812,294 ↑ 3%
Revenue 48.6 Billion ↓ 3%
Cost 41.4 Billion ↓ 1%
Profit 7.2 Billion ↓ 14%
Per Vehicle $2,560 ↓ 17%
2017

Kia Sales 2,724,226 ↓ 10%
Revenue 50.2 Billion ↑ 15%
Cost 41.8 Billion ↑ 19%
Profit 8.4 Billion ↓ 3%
Per Vehicle $3,083 ↑ 7%
2016

Kia Sales 3,018,093 ↑ 5%
Revenue 43.7 Billion ↑ 4%
Cost 35 Billion ↑ 4%
Profit 8.7 Billion ↑ 4%
Per Vehicle $2,883 ↓ 1%
2015

Kia Sales 2,871,453 ↓ 1%
Revenue 42.1 Billion ↓ 2%
Cost 33.7 Billion ↓ 2%
Profit 8.4 Billion ↓ 1%
Per Vehicle $2,925 ↑ ↓
2014

Kia Sales 2,896,775 ↑ 5%
Revenue 43 Billion ↓ 5%
Cost 34.5 Billion ↓ 3%
Profit 8.5 Billion ↓ 11%
Per Vehicle $2,934 ↓ 16%
2013

Kia Sales 2,746,832 ↑ 1%
Revenue 45.2 Billion ↑ 2%
Cost 35.6 Billion ↑ 4%
Profit 9.6 Billion ↓ 5%
Per Vehicle $3,495 ↓ 6%
2012

Kia Sales 2,709,359 ↑ 9%
Revenue 44.4 Billion ↑ 19%
Cost 34.3 Billion ↑ 20%
Profit 10.1 Billion ↑ 16%
Per Vehicle $3,728 ↑ 6%
2011

Kia Sales 2,478,451
Revenue 37.3 Billion
Cost 28.6 Billion
Profit 8.7 Billion
Per Vehicle $3,510
Kia Worldwide Vehicle Sales Pattern

Compare Automakers by Revenue
About       Contact       Privacy       Terms
F&I Tools Logo
© 2025 F&I Tools USA 

  • F&I Tools
  • Loan Calculator
  • Car Tax by State
  • DMV Fees
  • Manufacturer Warranties
  • Bank Payoffs
  • ELT Codes
  • Forms
  • Underwriting
  • Sales Report
  • F&I Menu
  • My Vehicle Title
  • Get My Lost Title
  • Bill of Sale
  • Insurance Companies
  • Roadside Assistance
  • Alpha Bravo
  • Credit Union Rates
  • VW Warranty
  • Chevy Warranty
  • Jeep Warranty
  • Ford Warranty
  • Toyota Warranty
  • Hyundai Warranty
  • About