F&I Tools
  • F&I Tools
  • Loan Calculator
  • Car Tax by State
  • DMV Fees
  • Manufacturer Warranties
  • Bank Payoffs
  • ELT Codes
  • Forms
  • Underwriting
  • Sales Report
  • F&I Menu
  • My Vehicle Title
  • Get My Lost Title
  • Bill of Sale
  • Insurance Companies
  • Roadside Assistance
  • Alpha Bravo
  • Credit Union Rates
  • VW Warranty
  • Chevy Warranty
  • Jeep Warranty
  • Ford Warranty
  • Toyota Warranty
  • Hyundai Warranty
  • About
Search
  F&I Tools Trademark®
  • Automaker Revenue
  • Renault

Renault Worldwide Sales by Year - Total Vehicles and Revenue


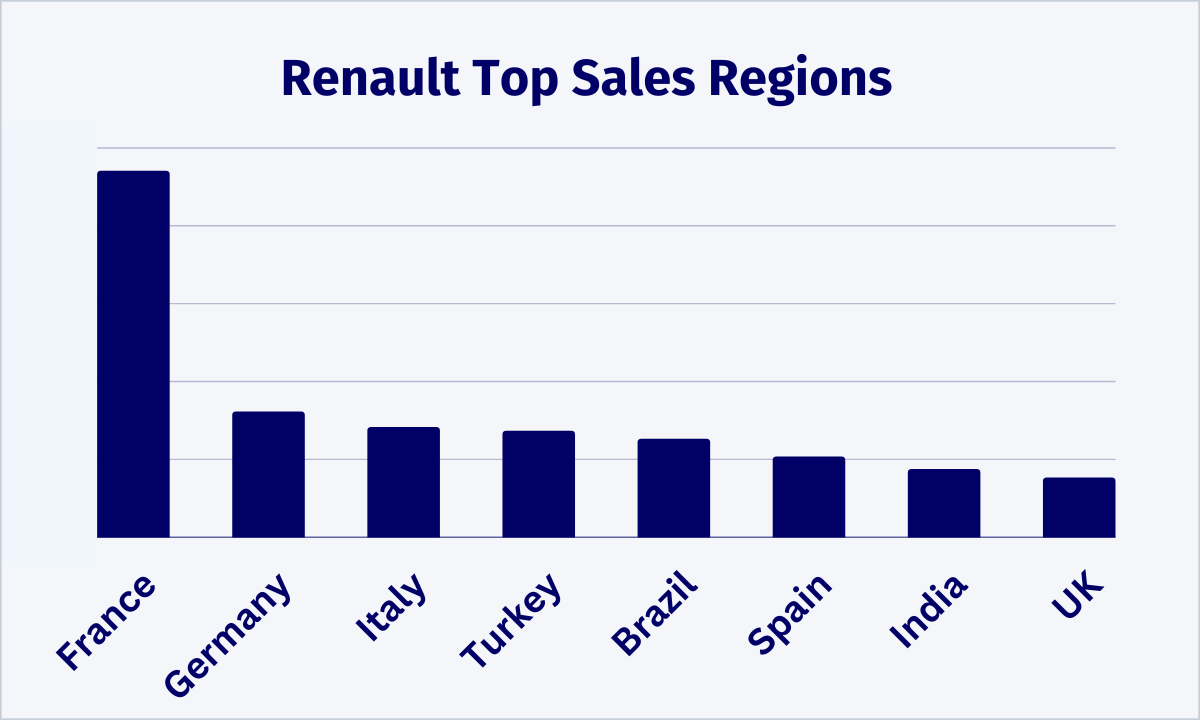
Renault worldwide sales reached 2.2 million vehicles for $58 billion in revenue for 2023.

Unit volume was up 9% by year with global revenue up 17% and profit up 23%.

Euros were converted to US Dollars for this report based on exchange rates from the end of each calendar year. 

The profit displayed is gross profit after the cost of materials is subtracted, but before administrative fees.
Renault Worldwide Sales
Year Category Stats Status
2023

Renault Sales 2,235,345 ↑ 9%
Revenue 57.9 Billion ↑ 17%
Cost 45.8 Billion ↑ 15%
Profit 12.1 Billion ↑ 23%
Per Vehicle $5,413 ↑ 13%
2022

Renault Sales 2,051,174 ↓ 24%
Revenue 49.5 Billion ↓ 9%
Cost 39.7 Billion ↓ 7%
Profit 9.8 Billion ↓ 15%
Per Vehicle $4,778 ↑ 11%
2021

Renault Sales 2,689,454 ↓ 5%
Revenue 54.2 Billion ↑ 2%
Cost 42.6 Billion ↓ 4%
Profit 11.6 Billion ↑ 32%
Per Vehicle $4,313 ↑ 45%
2020

Renault Sales 2,949,871 ↓ 21%
Revenue 53.3 Billion ↓ 14%
Cost 44.5 Billion ↓ 11%
Profit 8.8 Billion ↓ 28%
Per Vehicle $2,983 ↓ 8%
2019

Renault Sales 3,749,815 ↓ 3%
Revenue 62.3 Billion ↓ 5%
Cost 50.1 Billion ↓ 4%
Profit 12.2 Billion ↓ 11%
Per Vehicle $3,254 ↓ 8%
2018

Renault Sales 3,883,987 ↑ 3%
Revenue 65.7 Billion ↓ 7%
Cost 52 Billion ↓ 7%
Profit 13.7 Billion ↓ 7%
Per Vehicle $3,527 ↓ 10%
2017

Renault Sales 3,761,634 ↑ 9%
Revenue 70.5 Billion ↑ 31%
Cost 55.8 Billion ↑ 7%
Profit 14.7 Billion ↑ 27%
Per Vehicle $3,908 ↑ 17%
2016

Renault Sales 3,468,174 ↑ 23%
Revenue 54 Billion ↑ 9%
Cost 42.4 Billion ↑ 7%
Profit 11.6 Billion ↑ 16%
Per Vehicle $3,345 ↓ 6%
2015

Renault Sales 2,808,926 ↑ 3%
Revenue 49.5 Billion ↓ 1%
Cost 39.5 Billion ↓ 2%
Profit 10 Billion ↑ 6%
Per Vehicle $3,560 ↑ 3%
2014

Renault Sales 2,712,432 ↑ 3%
Revenue 49.9 Billion ↓ 12%
Cost 40.5 Billion ↓ 13%
Profit 9.4 Billion ↓ 7%
Per Vehicle $3,465 ↓ 10%
2013

Renault Sales 2,628,183 ↑ 3%
Revenue 56.5 Billion ↑ 4%
Cost 46.4 Billion ↑ 3%
Profit 10.1 Billion ↑ 8%
Per Vehicle $3,843 ↑ 4%
2012

Renault Sales 2,548,622 ↓ 6%
Revenue 54.5 Billion ↓ 1%
Cost 45.1 Billion ↑ ↓
Profit 9.4 Billion ↓ 8%
Per Vehicle $3,688 ↓ 2%
2011

Renault Sales 2,722,883
Revenue 55.2 Billion
Cost 45 Billion
Profit 10.2 Billion
Per Vehicle $3,746
Renault Worldwide Sales Regions

Compare Automakers by Revenue
About       Contact       Privacy       Terms
F&I Tools Logo
© 2025 F&I Tools USA 

  • F&I Tools
  • Loan Calculator
  • Car Tax by State
  • DMV Fees
  • Manufacturer Warranties
  • Bank Payoffs
  • ELT Codes
  • Forms
  • Underwriting
  • Sales Report
  • F&I Menu
  • My Vehicle Title
  • Get My Lost Title
  • Bill of Sale
  • Insurance Companies
  • Roadside Assistance
  • Alpha Bravo
  • Credit Union Rates
  • VW Warranty
  • Chevy Warranty
  • Jeep Warranty
  • Ford Warranty
  • Toyota Warranty
  • Hyundai Warranty
  • About