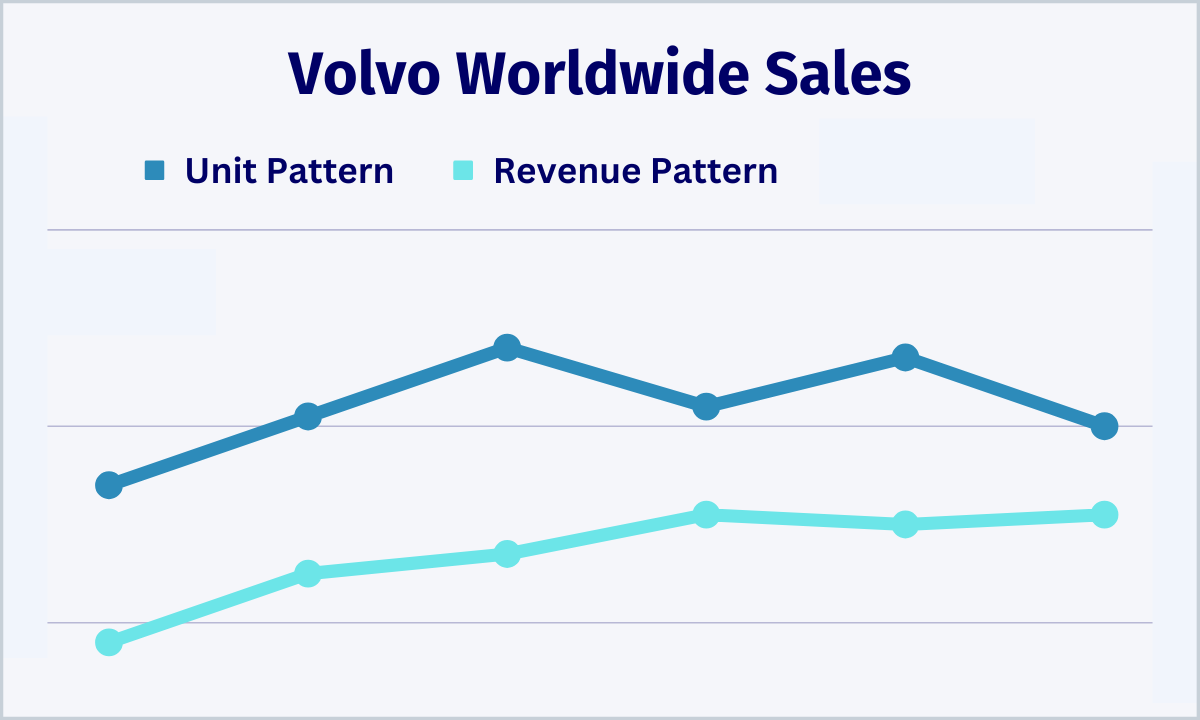
F&I Tools
  • F&I Tools
  • Loan Calculator
  • Car Tax by State
  • DMV Fees
  • Manufacturer Warranties
  • Bank Payoffs
  • ELT Codes
  • Forms
  • Underwriting
  • Sales Report
  • F&I Menu
  • My Vehicle Title
  • Get My Lost Title
  • Bill of Sale
  • Insurance Companies
  • Roadside Assistance
  • Alpha Bravo
  • Credit Union Rates
  • VW Warranty
  • Chevy Warranty
  • Jeep Warranty
  • Ford Warranty
  • Toyota Warranty
  • Hyundai Warranty
  • About
Search
  F&I Tools Trademark®
  • Automaker Revenue
  • Volvo

Volvo Worldwide Sales by Year - Total Vehicles and Revenue


Volvo worldwide sales reached 708,716 vehicles for $50 billion in revenue for 2023.

Unit volume was up 15% by year, global revenue was up 26%, and profit was up 33%.

Swedish Krona was converted to US Dollars for this Volvo global sales report using conversions rate from December 31st of each year listed. 

The profit displayed is gross profit after the cost of materials is subtracted, but before administrative fees.
Volvo Worldwide Sales
Year Category Stats Status
2023

Volvo Sales 708,716 ↑ 15%
Revenue 39.8 Billion ↑ 26%
Cost 32.1 Billion ↑ 24%
Profit 7.7 Billion ↑ 33%
Per Vehicle $10,865 ↑ 15%
2022

Volvo Sales 615,121 ↓ 12%
Revenue 31.7 Billion ↑ 1%
Cost 25.9 Billion ↑ 6%
Profit 5.8 Billion ↓ 13%
Per Vehicle $9,429 ↓ 2%
2021

Volvo Sales 698,700 ↑ 6%
Revenue 31.2 Billion ↓ 3%
Cost 24.5 Billion ↓ 7%
Profit 6.7 Billion ↑ 20%
Per Vehicle $9,589 ↑ 13%
2020

Volvo Sales 661,700 ↓ 6%
Revenue 32.1 Billion ↑ 10%
Cost 26.5 Billion ↑ 12%
Profit 5.6 Billion ↑ ↓
Per Vehicle $8,463 ↑ 7%
2019

Volvo Sales 705,452 ↑ 10%
Revenue 29.3 Billion ↑ 4%
Cost 23.7 Billion ↑ 4%
Profit 5.6 Billion ↑ 2%
Per Vehicle $7,938 ↓ 7%
2018

Volvo Sales 642,253 ↑ 12%
Revenue 28.3 Billion ↑ 10%
Cost 22.8 Billion ↑ 13%
Profit 5.5 Billion ↓ 3%
Per Vehicle $8,564 ↓ 14%
2017

Volvo Sales 571,577 ↑ 7%
Revenue 25.8 Billion ↑ 30%
Cost 20.1 Billion ↑ 29%
Profit 5.7 Billion ↑ 33%
Per Vehicle $9,972 ↑ 24%
2016

Volvo Sales 534,332 ↑ 6%
Revenue 19.9 Billion ↑ 2%
Cost 15.6 Billion ↑ 3%
Profit 4.3 Billion ↑ ↓
Per Vehicle $8,047 ↓ 6%
2015

Volvo Sales 503,127 ↑ 8%
Revenue 19.5 Billion ↑ 11%
Cost 15.2 Billion ↑ 4%
Profit 4.3 Billion ↑ 43%
Per Vehicle $8,547 ↑ 33%
2014

Volvo Sales 465,866 ↑ 9%
Revenue 17.6 Billion ↓ 7%
Cost 14.6 Billion ↓ 8%
Profit 3 Billion ↓ 6%
Per Vehicle $6,439 ↓ 14%
2013

Volvo Sales 427,840 ↑ 1%
Revenue 19 Billion ↓ 1%
Cost 15.8 Billion ↓ 2%
Profit 3.2 Billion ↑ 7%
Per Vehicle $7,479 ↑ 5%
2012

Volvo Sales 421,951 ↓ 6%
Revenue 19.1 Billion ↑ 5%
Cost 16.1 Billion ↑ 7%
Profit 3 Billion ↓ 6%
Per Vehicle $7,109 ↓ 1%
2011

Volvo Sales 449,255
Revenue 18.2 Billion
Cost 15 Billion
Profit 3.2 Billion
Per Vehicle $7,123
Volvo Worldwide Vehicle Sales Pattern

Compare Automakers by Revenue
About       Contact       Privacy       Terms
F&I Tools Logo
© 2025 F&I Tools USA 

  • F&I Tools
  • Loan Calculator
  • Car Tax by State
  • DMV Fees
  • Manufacturer Warranties
  • Bank Payoffs
  • ELT Codes
  • Forms
  • Underwriting
  • Sales Report
  • F&I Menu
  • My Vehicle Title
  • Get My Lost Title
  • Bill of Sale
  • Insurance Companies
  • Roadside Assistance
  • Alpha Bravo
  • Credit Union Rates
  • VW Warranty
  • Chevy Warranty
  • Jeep Warranty
  • Ford Warranty
  • Toyota Warranty
  • Hyundai Warranty
  • About